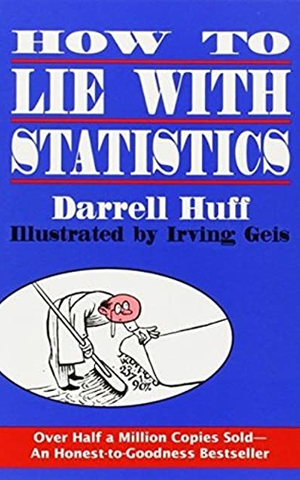
Darrell Huff runs the gamut of every popularly used type of statistic, probes such things as the sample study, the tabulation method, the interview technique, or the way the results...
Show More
Number of Pages: 142
ISBN: 0393310728
ISBN-13: 9780393310726
Mentions
See All
Bill Gates @BillGates
·
Mar 18, 2015
- Curated in 6 books I recommended for TED 2015
I picked this one up after seeing it on a Wall Street Journal list of good books for investors. It was first published in 1954, but it doesn’t feel dated (aside from a few anachronistic examples—it has been a long time since bread cost 5 cents a loaf in the United States). In fact, I’d say it’s more relevant than ever. One chapter shows you how visuals can be used to exaggerate trends and give distorted comparisons. It’s a timely reminder, given how often infographics show up in your Facebook and Twitter feeds these days. A great introduction to the use of statistics, and a great refresher for anyone who’s already well versed in it.
Bill Gates @BillGates
·
May 19, 2015
- Curated in Beach reading (and more) (2015)
I picked up this short, easy-to-read book after seeing it on a Wall Street Journal list of good books for investors. I enjoyed it so much that it was one of a handful of books I recommended to everyone at TED this year. It was first published in 1954, but aside from a few anachronistic examples (it has been a long time since bread cost 5 cents a loaf in the United States), it doesn’t feel dated. One chapter shows you how visuals can be used to exaggerate trends and give distorted comparisons—a timely reminder, given how often infographics show up in your Facebook and Twitter feeds these days. A useful introduction to the use of statistics, and a helpful refresher for anyone who is already well versed in it.
Jason Zweig @JasonZweig
·
Nov 25, 2014
- Curated in Best Books For Investors: A Short Shelf
This puckish riff on how math can be manipulated is only 142 pages; most people could read it on a train ride or two, or in an afternoon at the beach. As light as the book is, however, it is nevertheless profound. In one short take after another, Huff picks apart the ways in which marketers use statistics, charts, graphics and other ways of presenting numbers to baffle and trick the public. The chapter “How to Talk Back to a Statistic” is a brilliant step-by-step guide to figuring out how someone is trying to deceive you with data.