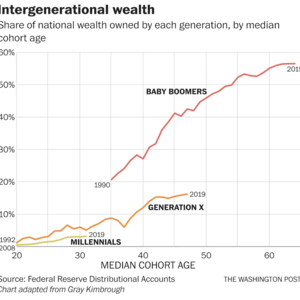
Have you seen this chart? I have seen it many times. It comes from this Washington Post article, but it seems to go viral on Twitter about every 6 months or so. The implication of t...
Show More
Mentions
There are no mentions of this content so far.